Validating the value of
Data Quality Monitors in ELT users
The Challenge
Managing data is a huge task. Even with a fleet of products made to streamline the ETL process, data analysts today struggle with preparing data for their pipelines. While it gets easier to manage data source and warehouse connections, managing the quality of the data transmitted between them remains cumbersome and overly manual.
When data errors are not caught, faulty data hits the pipeline and then is replicated throughout a user’s production system–often to devastating downstream impacts.

The Plan
In-depth interviews and prototype usability tests will be conducted with current end users. User feedback will be validated via a facilitated design workshop of select internal users.
The Goal
To validate the value of the proposed features with end users and the internal product org, and to drive alignment on upcoming product strategy.
The Why
The ETL space is crowded, and there was no clear competitor offering the proposed feature set. By filling a gap in the market, we may increase user retention and become more competitive in the market space.
Project Proposal
The Team
-
My direct partner on the project
-
Built the prototype of the proposed features
-
Provided insight on technical feasibility, time and money cost of proposed solutions
-
Ideated on the early prototypes within our design system; participated in co-design sessions

Methodologies
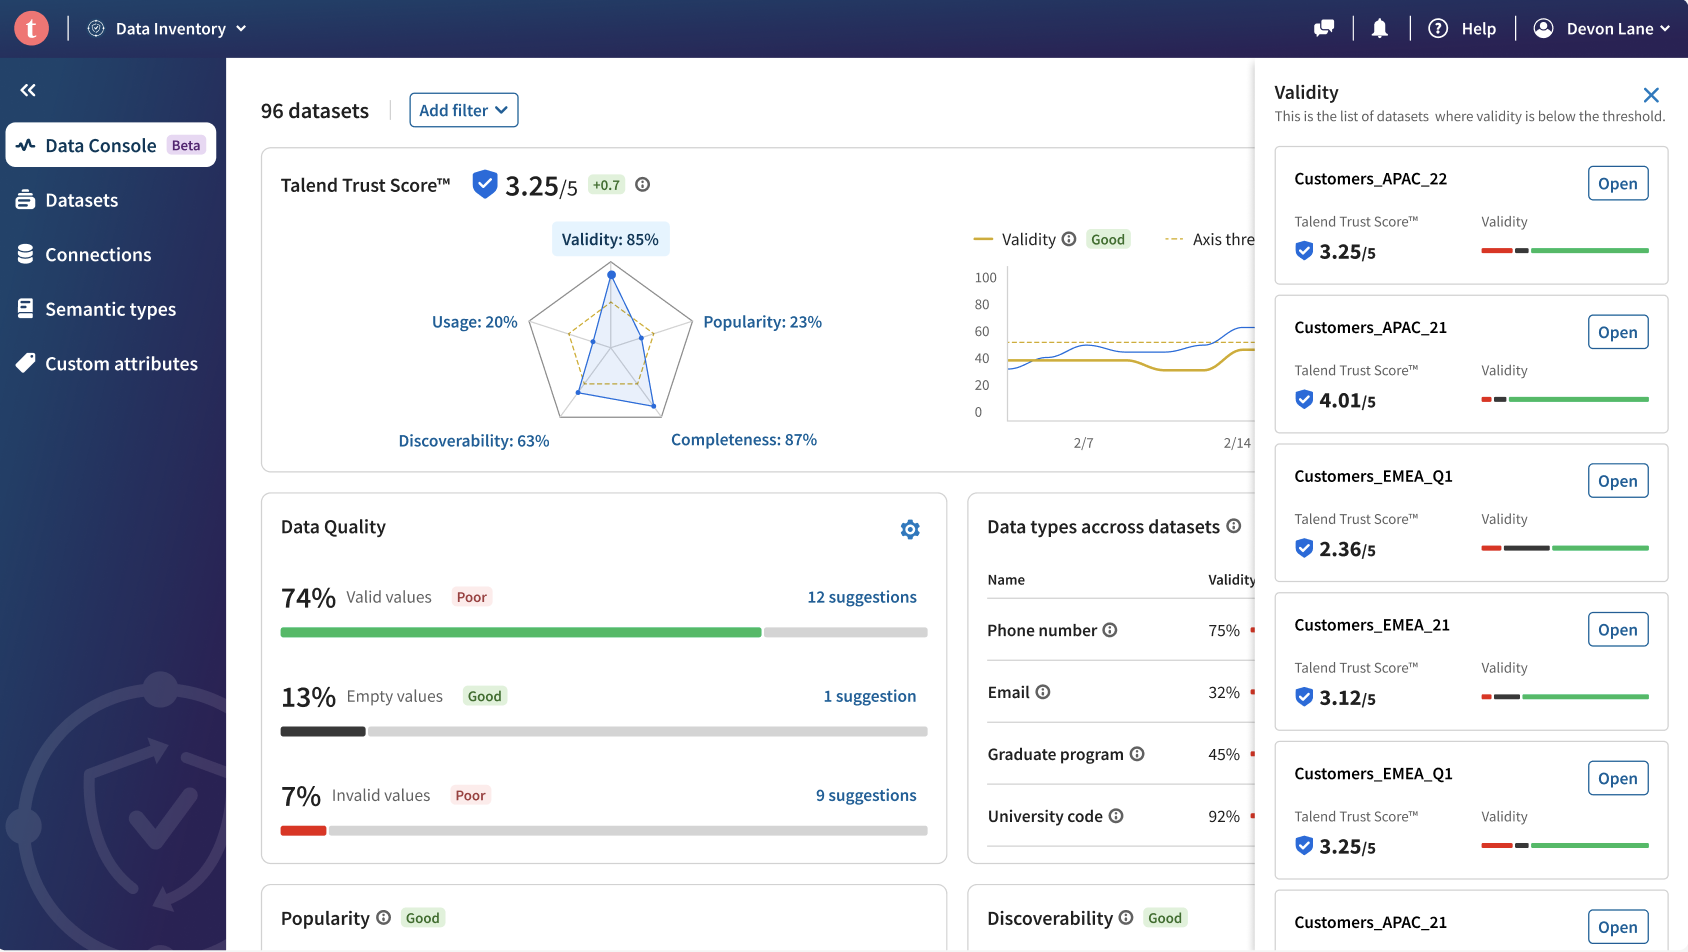
Users were first introduced to an early prototype of the proposed DQM features. Reactions to this prototype, user pathways, and general feedback were logged and delivered to product teams. The resulting development of the Data Health Console was later tested with both end and internal users.
Using initial end user feedback, I led a co-design workshop with product designers to refine the early prototype into its next iteration: the Data Health Console. The DHC was then shared with a selective group of internal users and a series of 3 international workshops was facilitated in order to prioritize beta features. Methods used: card sorts, tree tests, heuristic exercises, and forced rankings.
Feedback from across methodologies was arranged on a digital whiteboard and organized into narrative points through a guided exercise with project stakeholders. A report of the findings was presented to Product and Engineering teams, with my recommendations for product strategy. Collaborative conversation around the research results was facilitated in order to drive alignment on the impact to product roadmaps.
Remote moderated usability tests
Participatory Design
Affinity + Landscape Mapping
In-Depth Interviews
Users were posed a series of scripted questions in order to gauge sentiment around the prospective feature and the current product, and to evaluate user needs and pain points.
To baseline fixed answers to fixed sentiment and use case questions, a broader user survey was sent out in waves to different segments of 1200 users. Survey data was compared to user engagement and clickstream data pulled from the Stitch and Talend products.
Surveys + Heat Maps
Unexpected Feedback
In addition to the monitors offered, several monitor types that did not appear in the prototype were requested by a comparatively high number of users, and were later included in the beta version of the feature.
Additional unexpected feedback centered around previously unexplored integrations with 3rd party products, product licensing models, and our current design systems. Secondary sprints on these topics opened doors to rethinking company protocols in sales, marketing, and pricing departments.
The Findings
We started this project with certain fixed questions that we were able to answer through user engagement:
Which monitors matter most to users?
How do users want to be alerted?
How often would users run the monitors?
Other points of feedback unrelated to our original inquiries was also gathered from users, and helped to shape the feature’s architecture and interaction with other products:
Users wanted the monitors to run before ingestion, not after
The market value of integrating this product with others, including 3rd party products, became clear

Outcomes
New Roadmap Timelines
Given the high level of user interest in data quality monitors, and the high level of alignment between user and internal feedback, 3-year product releases were reprioritized so as to be releasable within 1 year.
Feature released in beta
Refined with feedback gathered from the usability tests and qualitative interviews, a complete beta version of the feature concept was built and released to a select group of clients. Ongoing study of user beta interaction was gathered for live product release.
Deeper user understanding
Similar feature sets were evaluated amongst two different user segments, and the differences in their responses analyzed. Patterns among user bases fueled deeper understanding of the persona pain points and use cases, with broad value.


